April 9th, 2024
Unraveling the Paired T-Test
By Rahul Sonwalkar · 9 min read

Overview
In the realm of statistical analysis, the paired T-test stands out as a powerful tool for researchers and analysts. This test, sometimes referred to as the dependent sample t-test, is designed to determine if there's a significant mean difference between two sets of observations. But what does this mean in practice, and why is it important? Let's delve into the intricacies of the paired T-test and its assumptions.
Understanding the Paired T-Test
Setting the Hypotheses
The paired T-test operates on two competing hypotheses:
- Null Hypothesis (H0): Assumes that the true mean difference between the paired samples is zero. This means that any observed differences can be attributed to random variation.
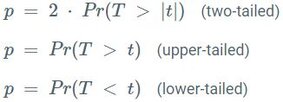
- Alternative Hypothesis (H1): Assumes that the true mean difference between the paired samples is not zero. This can be two-tailed (not equal to zero), upper-tailed (greater than zero), or lower-tailed (less than zero).
Assumptions of the Paired T-Test
1. Level of Measurement: The data should be numeric and continuous. For instance, data that can take on any value within a range, like income or height.
2. Independence: Observations should be independent of one another. This means that measurements taken on one subject should not influence measurements taken on another.
3. Normality: The data should approximate a normal distribution. This can be visually inspected using tools like histograms or Q-Q-Plots. If the data isn't normal, transformations might be necessary.
4. Absence of Outliers: Outliers, or rare values that deviate significantly from other observations, can skew results. It's essential to identify and address outliers, either by removing them or using non-parametric tests.
Procedure of the Paired T-Test


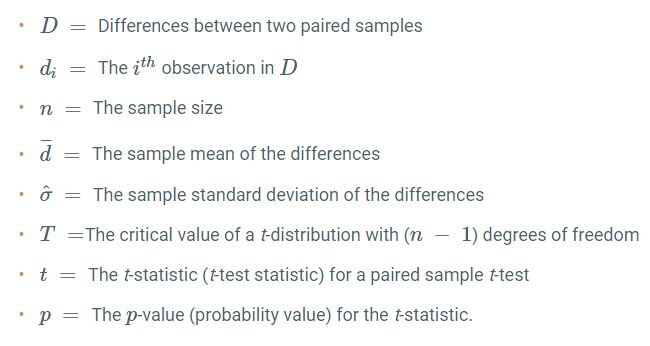
2. Calculate the Sample Standard Deviation: This measures the amount of variation or dispersion in the differences.


Interpreting the Results
- Statistical Significance: A low p-value indicates that the observed data is inconsistent with the null hypothesis, suggesting the alternative hypothesis might be true.
- Practical Significance: Beyond just statistical significance, the results should have practical implications. For instance, a small difference might be statistically significant but not practically meaningful.
Conclusion
The paired T-test is a robust statistical tool that offers valuable insights into the differences between paired observations. By understanding its assumptions and applications, researchers and analysts can harness its power to draw meaningful conclusions from their data. Whether you're a seasoned statistician or a beginner, the paired T-test is a valuable addition to your analytical toolkit. And with tools like Julius at your disposal, the process becomes even more straightforward and efficient.
Julius offers a streamlined approach to data analysis, helping you conduct paired T-tests with ease. Whether you're checking assumptions, calculating p-values, or interpreting results, Julius provides a user-friendly interface and expert guidance every step of the way. With Julius, you can ensure that your paired T-test is conducted accurately, giving you reliable and actionable insights.
